EMT Practice Test

1. Question Content...


Question List

Question1: Which of the following are the options to export the data used to build the view / visualisations?

Question2: How does Tableau know at which level to aggregate values?

Question3: DOWNLOAD THE DATASET FROM:
https://drive.google.com/drive/folders/1WXzqsrNmXVdmQ-574wld4InEplyKT8RP?usp=sharing (if you haven't already) Using the cwurData table, plot a Map to see which country had the Second highest number of patents in the Year 2013?

Question4: Using the Geo Data Table, create a Map showing Sales made per State. For the State of New York (NY), what was the amount in Sales ($) made for Phone Assortments with White color?

Question5: For Bullet Graphs we need at least ____________ measures
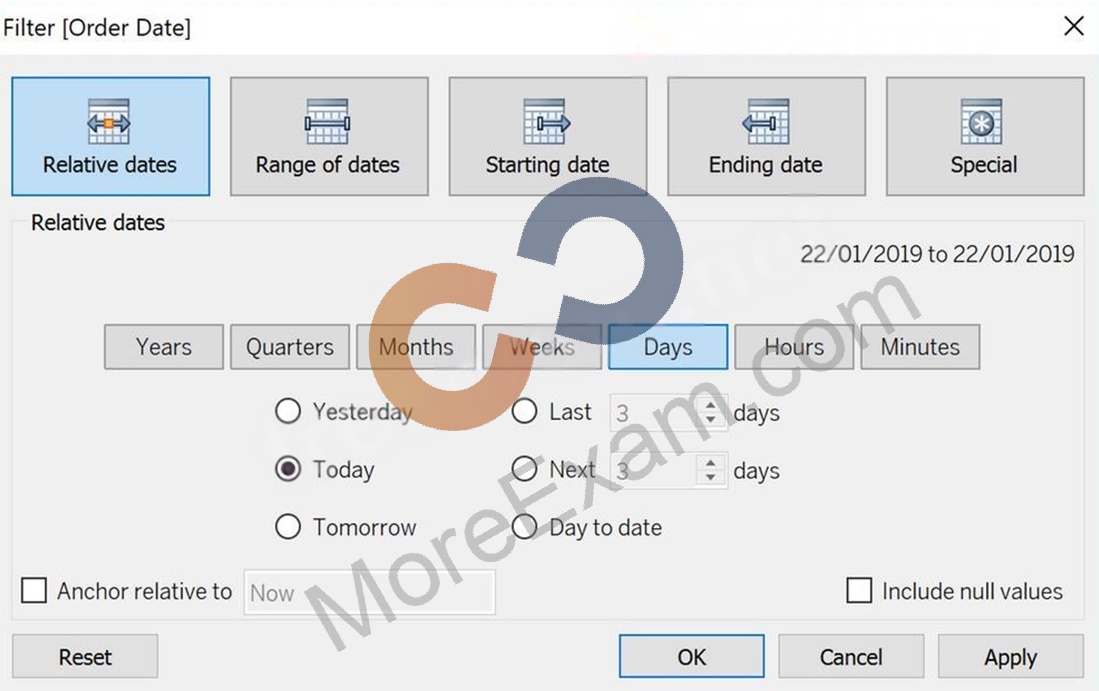
Question6: If you see the following Filter, then you're working with _______________________ Larger image

Question7: True or False: We can disaggregate the data, to see all of the marks in the view at the most detailed level of granularity

Question8: Which one of the following is a dimension?

Question9: Data blending simulates a traditional _________________ Join

Question10: True or False: A LEFT JOIN or INNER JOIN creates a row each time the join criteria is satisfied, which can result in duplicate rows. One way to avoid this is to use data blending instead.

Question11: Using the Geo Data table, create a Bar chart showing the In-Stock percentage for each Color. What is the Average In-Stock percentage for the Color Red? Present your answer correctly upto 2 decimal places.

Question12: According to Tableau's 'Order of Operations', which of the following filters is applied FIRST?

Question13: Suppose you have a bar chart. When we group by labels in a view, which of the following happens?

Question14: Using the CoffeeChain table, create a chart to see the monthly Percent difference change in Profit, from the beginning of 2012 to the end of 2013. How many months saw a Negative percent difference in Profit?

Question15: Is it possible to use measures in the same view multiple times (e.g. SUM of the measure and AVG of the measure)?

Question16: When using a Blend, what is the color of tick-mark on the primary and secondary data sources respectively?

Question17: When exporting a worksheet as an image in Tableau, which of the following file formats are available?

Question18: Is it possible to add both a Dashboard and a Worksheet at the same time to a Story Point in Tableau?

Question19: You can use the __________________ in Tableau to clean / organise your data.

Question20: In Tree maps, the size begins with the largest rectangle on the ________________ and the smallest rectangle on the ________________.

Question21: _____________ contains the visualisations, info needed to build the visualisations, and a copy of the data source.

Question22: Which of the following is a valid way to create Sets in Tableau?

Question23: A Tableau Support case can be opened in which of the following valid ways?

Question24: Which of these is NOT a type of Quick Filter available in Tableau?

Question25: Using the cwurData table, create a cross-tab showing the number of Publications per Country broken down by Institution, and filtered by Country to only show United Kingdown (UK). For the University of Manchester, what percent of the total publications were contributed in 2014?

Question26: What will the following function return?
LEFT("Tableau", 3)

Question27: _________________ is useful when you need to change how the data source is configured on a sheet-by-sheet basis, and when you want to combine databases that don't allow relationships or joins

Question28: Which of the following are valid reasons to use a Tableau Data Extract (.tde) over Live Connections?

Question29: What is the one critical difference between normal calculated fields, and the calculated fields created after Data blending?

Question30: Download the Dataset from:
https://drive.google.com/file/d/12AYHfiPWkwBmvH0zbumOURgUX6Az00Rw/view?usp=sharing Using the Time Series Table, create a line chart to show Sales over time. Which Month and Year witnessed the lowest Sales?

Question31: Using the dataset, plot a Map showing all the countries, filtered by Market to only include LATAM. Which country in the LATAM Market has the highest shipping delay (sum of total number of days between the order date and the ship date)?

Question32: Create a Set containing Customer Names whose Sales are GREATER than 30,000. Which customer had the LEAST sales in this set?

Question33: ______________ refers to the level of detail for a piece of data, wherever you are looking.

Question34: To use a quick table calculation, which of the following programming languages do you need to know?

Question35: Is it possible to deploy a URL action on a dashboard object to open a Web Page within a dashboard rather than opening the system's web browser?

Question36: Is it possible to make a Measure discrete?

Question37: How can you MANUALLY assign geographic roles to a dimension from the data pane?

Question38: You have cleaned a data source properly, created some calculated fields and renamed some columns. You want to save these changes for future use cases. Which of the following would BEST satisfy this requirement?

Question39: True or False: Trend lines can only be used with numeric or date fields

Question40: When you want to first apply a filter and THEN show the Top N or Bottom N elements, which of the following filters would you use?

Question41: When working with Excel, text file data, JSON file, .pdf file data, you can use _________________ to union files across folders, and worksheets across workbooks. Search is scoped to the selected connection.

Question42: True or False: Sets can be created on Measures

Question43: ______________ is a method for appending values (rows) to tables. You can use this method if both tables have the same columns. The result is a virtual table that has the same columns but extends vertically by adding rows of data.

Question44: Which of the following would you use to edit the Shape, colour, and Text of your visualisations?

Question45: You want to add Custom shapes to your visualisation. Where can you add these new shapes?

Question46: Given a map, which of the following fields can be placed in Size,Shape,Detail,Color

Question47: True or False: The Highlighting action can be disabled for the entire workbook.

Question48: Which of the following is NOT a valid official data source in Tableau Desktop?

Question49: What is a story point in Tableau?

Question50: Which Sub-Category had the least Profit in the Office Supplies category?

Question51: Which of the following is a benefit of using a Tableau Data Source (.tds)?

Question52: Using the Time Series table, create a cross-tab showing sales for each Assortment broken down by Year and Quarter. In Q4 of October 2017, what was the Average sales amount for the Hardware assortment?

Question53: A ________________ is a single zip file that contains a workbook along with any supporting local file data and background images. This format is the best way to package your work for sharing with others who don't have access to the original data.

Question54: If you have a dashboard and are displaying its filter, how can you rearrange it?

Question55: What is the minimum amount of RAM recommended for any production use of Tableau Server?

Question56: True or False: Tableau can create worksheet-specific filters

Question57: Which of the following is NOT a new feature introduced in Tableau 2020.1?

Question58: True or False: Context Filters are executed after Data Source filters